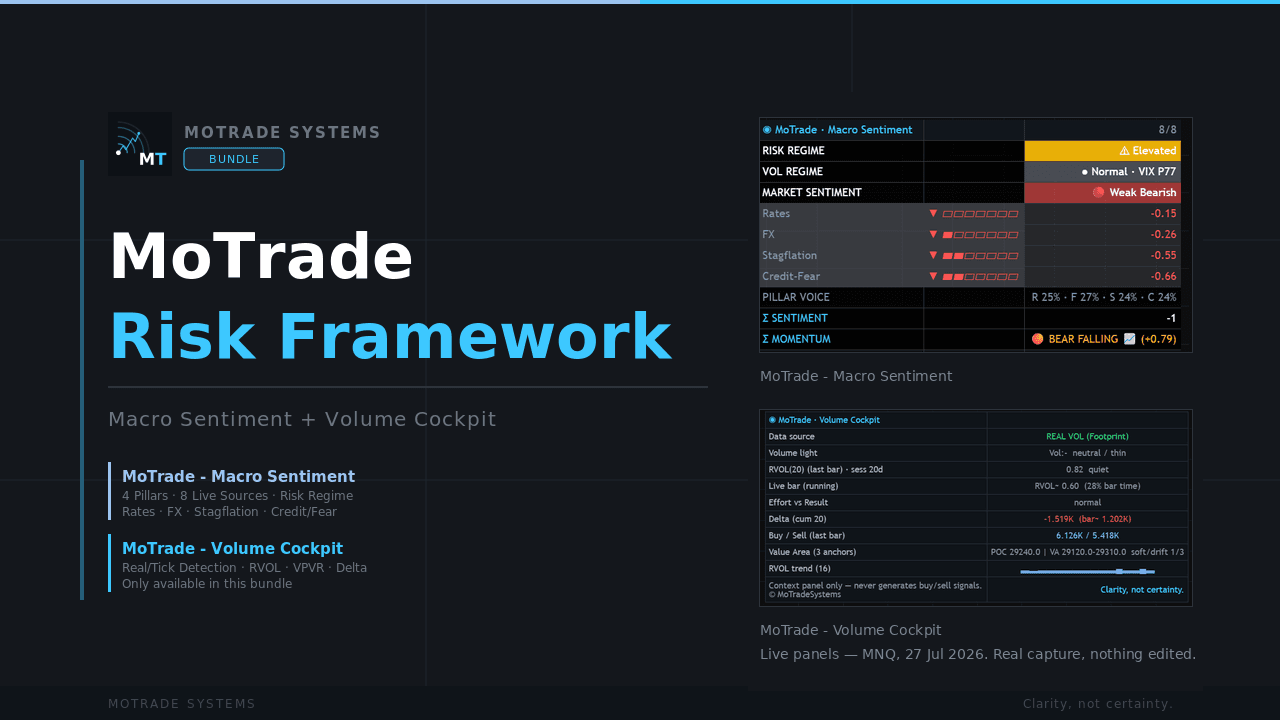
Both of our TradingView panels in one purchase: one reads how risky the overall market is right now, the other shows whether a price move is backed by real trading volume. Together they help you decide how much to risk and when to stay out — they don’t hand you trades to take.
Two panels that work together on one chart.
One panel tells you the environment. The other tells you whether the move is real.
01
How risky is the market?
MoTrade - Macro Sentiment
Reads eight market indicators — interest rates, the dollar, oil and copper, corporate credit and the fear gauge — and sums them into one reading: calm, elevated, or stressed. That tells you when to trade smaller or stay out.
02
Is this move real?
MoTrade - Volume Cockpit
Shows the actual trading volume behind a move — how much is really changing hands versus a normal time of day, whether buyers or sellers are in control, and which price levels hold up. A move with no volume behind it is a warning, not an opening.
Why bundle-only: macro regime and volume confirmation are designed to work as one context layer, on one chart — which is why MoTrade - Volume Cockpit is not sold separately.
✓MoTrade - Macro Sentiment — tells you from eight live indicators whether the market is calm, elevated or stressed right now
✓MoTrade - Volume Cockpit — shows whether real trading volume backs a move or whether it's a fake-out. Only available in this bundle.
✓One-time purchase — permanent access to both scripts, no recurring fees
✓Invite-only TradingView access, provisioned within 24 hours
✓One-time price — you own it, no renewal
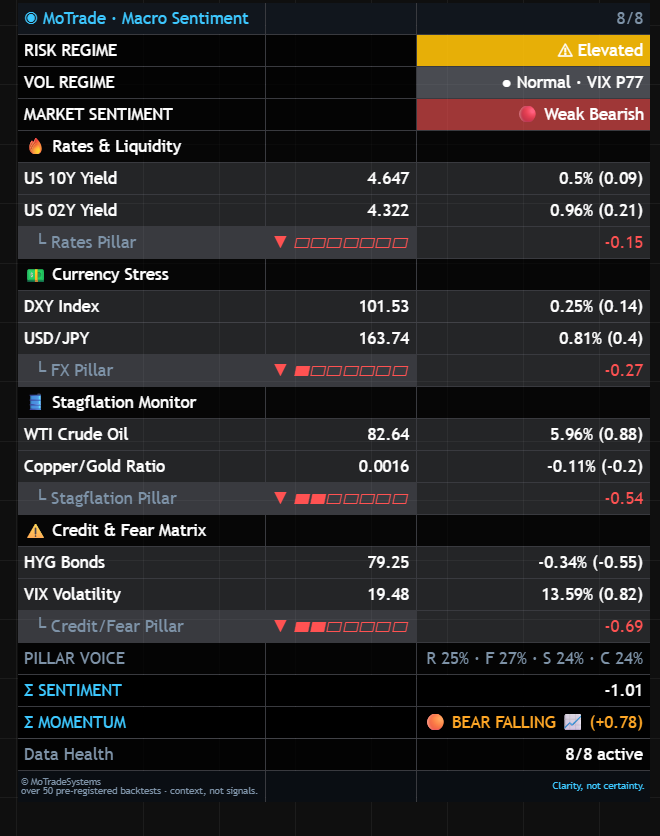
The Macro Sentiment panel — read row by row
Real rows from the live panel, each explained. This is a real screenshot of the panel — the values shown are one example state it can display, not a live measurement of current market conditions.
1MARKET SENTIMENT
You see:
🔴 Weak Bearish
It means:
The headline read — the standardized composite sorted into five risk-on / risk-off classes. Weak Bearish means the backdrop is leaning risk-off.
You do:
Your one-glance climate check — it lets you set risk to the room you're actually in before you commit, not after. Never a sell signal.
2RISK REGIME
You see:
⚠ Elevated
It means:
A non-directional line built from the size of the composite move — it flags when conditions are dislocated, not which way price goes.
You do:
Elevated is your cue to trade smaller — dislocated tape is where crowded trades reverse hardest and oversized bets get punished. Not a direction.
3Credit & Fear Matrix
You see:
▼ risk-off
It means:
One of the four pillars — high-yield bonds down and VIX up means credit stress and fear are rising.
You do:
It tells you WHICH stress is driving the room — so when credit and fear lead, you respect the downside instead of just the chart. Not a trade in itself.
4Σ SENTIMENT
You see:
−1.01 (Weak-Bearish band)
It means:
The composite number the class is derived from — negative is risk-off, and its size grades how far the backdrop is stretched.
You do:
The graded number saves you from binary thinking — a mild −1.01 says lean cautious, a deep −2 says the whole room is risk-off. Context, not a level to enter or exit at.
5Σ MOMENTUM
You see:
🟠 Bear Falling (+0.78)
It means:
Whether the current bull-or-bear read is intensifying or turning — the one-day change in the composite, not a new direction. Orange marks a turn either way.
You do:
Here it's a bearish read whose pressure just eased, not one that's deepening — still risk-off, but the day's move went the other way. A pace hint, not a reversal call.
6Data Health
You see:
8/8
It means:
How many of the eight live feeds are active. 8/8 is full reliability; fewer means some pillars are muted.
You do:
Check it first — it's your honesty gauge. Below 8/8 you trust the read less, instead of acting on a half-blind panel.
Real screenshot of the panel. It shows context — no buy/sell signals, no price targets. The decision stays yours. Backtest ≠ Live.
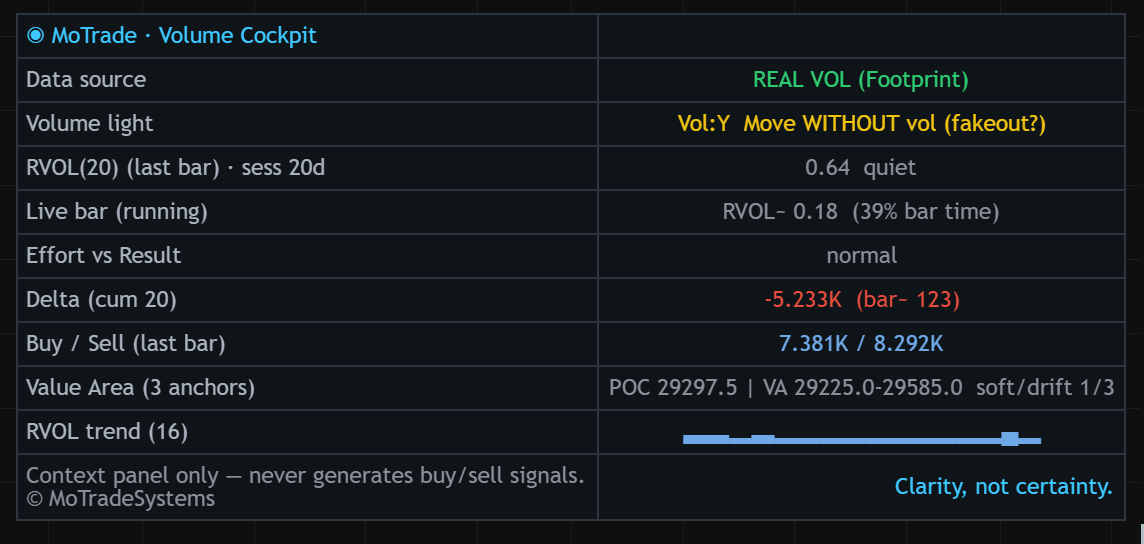
The Volume Cockpit panel — read row by row
Real rows from the live panel, each explained. This is a real screenshot of the panel — the values shown are one example state it can display, not a live measurement of current market conditions.
1Data source
You see:
REAL VOL (Footprint)
It means:
Where the volume comes from — real exchange volume, versus a broker tick proxy that the panel flags with a warning.
You do:
It tells you upfront whether the volume is real — so you don't build a decision on a tick proxy that only looks precise.
2Volume light
You see:
Vol:- — neutral / thin
It means:
The headline read of the last closed bar: does volume back the move. A dash means neither side confirmed — the bar is thin, low-participation.
You do:
A neutral read isn't a signal to fade or chase — it just means there's nothing here yet worth reading into. Context, not an entry trigger.
3RVOL(20)
You see:
0.82× (quiet)
It means:
Volume against its own 20-bar average. At or above 1.5× the bar is “in play”; well below, it's quiet.
You do:
It tells you how much a bar's move is worth trusting — quiet bars get less weight, so a big candle nobody traded doesn't fool you.
4Effort vs Result
You see:
normal
It means:
Compares the bar's range to its volume — a normal read means the two are in proportion; “exhaustion” would flag a large range on little volume.
You do:
A normal read has nothing to flag — no divergence between how far price moved and how much traded behind it. Context, not a call.
5Value Area (3 anchors)
You see:
POC 29240.0 · VA 29120.0–29310.0
It means:
The volume profile's Point of Control and Value Area, built from three session anchors — where volume has concentrated and price has been accepted.
You do:
It shows where price was actually accepted, so you frame decisions around real acceptance zones instead of round numbers. Not entry or target levels.
6RVOL trend (16)
You see:
Falling (volume fading)
It means:
A sparkline of relative volume over recent bars — rising means participation is building, falling means it's drying up.
You do:
The trend tells you if participation is building or drying up — so you know whether the tape is waking up or fading before you lean on it. Not timing.
Real screenshot of the panel. It shows context — no buy/sell signals, no price targets. The decision stays yours. Backtest ≠ Live.
Same move, different truth
Two price moves with the same shape. The volume underneath them is what separates a move that is being paid for from one that is running on empty.
Backed by volume
Price advances and the trading behind it grows with the move. Someone is paying for this.
No volume behind it
The same advance, but the trading behind it never shows up — and the move gives it all back.
Both curves are synthetic and drawn to illustrate the difference — they are not market data and refer to no instrument, date or period. The panel reads this relationship on your live chart; what it shows there is a measurement, this is a drawing of the idea.
Risk management usually gets scattered across a dozen separate indicators, so nobody really watches it. This bundle puts it in one place with two panels: the first shows how risky the overall market is, the second checks whether a price move is actually backed by trading. Together they keep you from hunting for trades in conditions that don't support them.
How it works — honestly
Both modules follow the same engineering standard: robust statistics over point estimates, confirmed bars over live guesses, and explicit uncertainty labeling over false precision. Everything is anti-lookahead and non-repainting by construction, and every structural claim in the panels is either marked 'confirmed' or honestly labeled as drifting context. The framework was validated against 50+ pre-registered backtests with sealed holdouts and published null results — which is exactly why it gives you context and risk framing, not entries. What it can't do — and never will: predict the next candle.
What it is not
Bodyguard, not a crystal ball.
This is a context panel, not a signal generator. It never produces buy signals, sell signals, or price targets — the decision stays yours. Education/analysis — not investment advice. Backtest ≠ Live. Past or simulated results do not indicate future results.
What you pay — and what you don’t get
$97, paid once. No subscription, no auto-renewal.
You get
✓Invite-only access on TradingView, added to your account within 24 hours
Checkout runs on our secure transaction page: enter your TradingView username, pay once via Stripe, and access is provisioned for your account within 24 hours.