
Trading the break of yesterday's value area
The rule
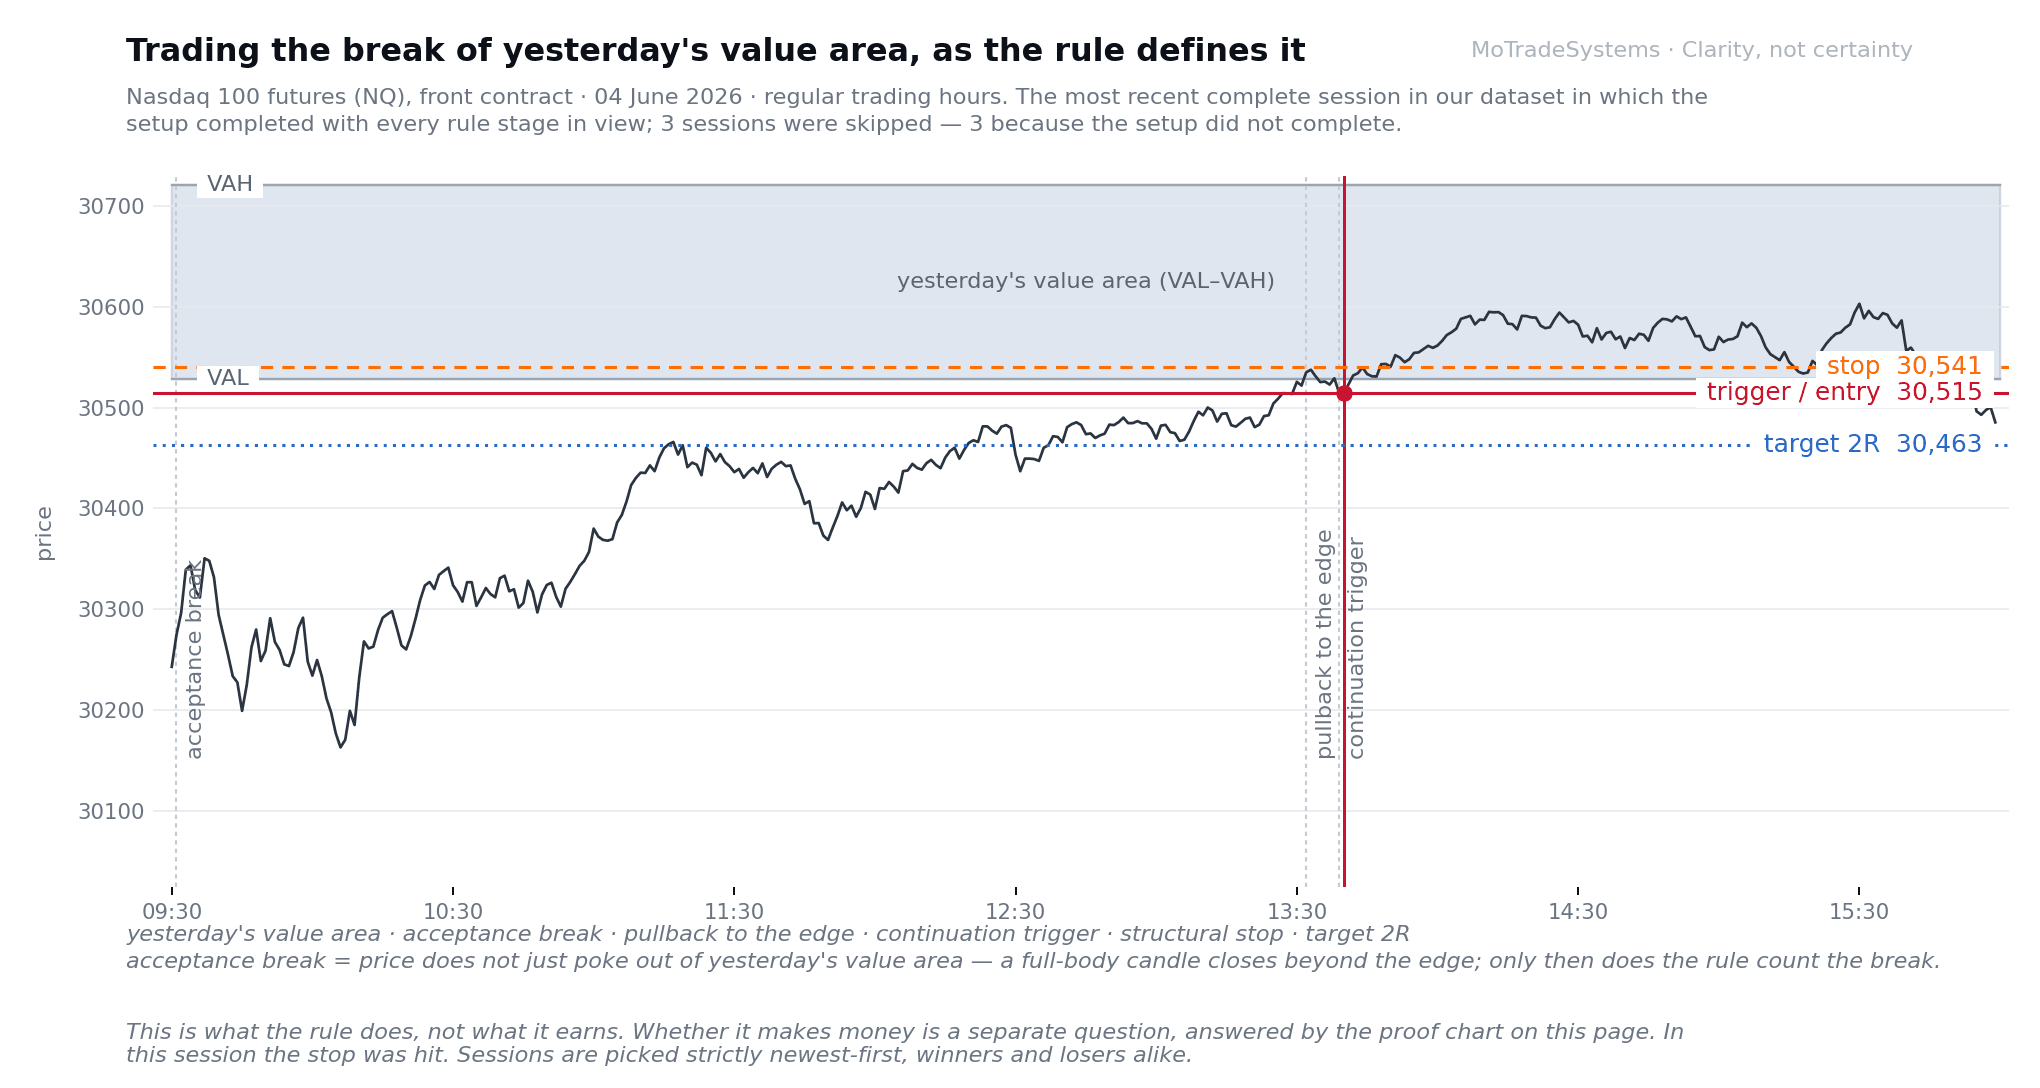
Most of yesterday's business happened inside one price band. When today's price leaves that band and holds outside it, the reasoning goes, the market has repriced — and you go with it. It is the core move of volume-profile trading, and unlike most retail rules it rests on something real: that band is where trade actually took place.
The verdict
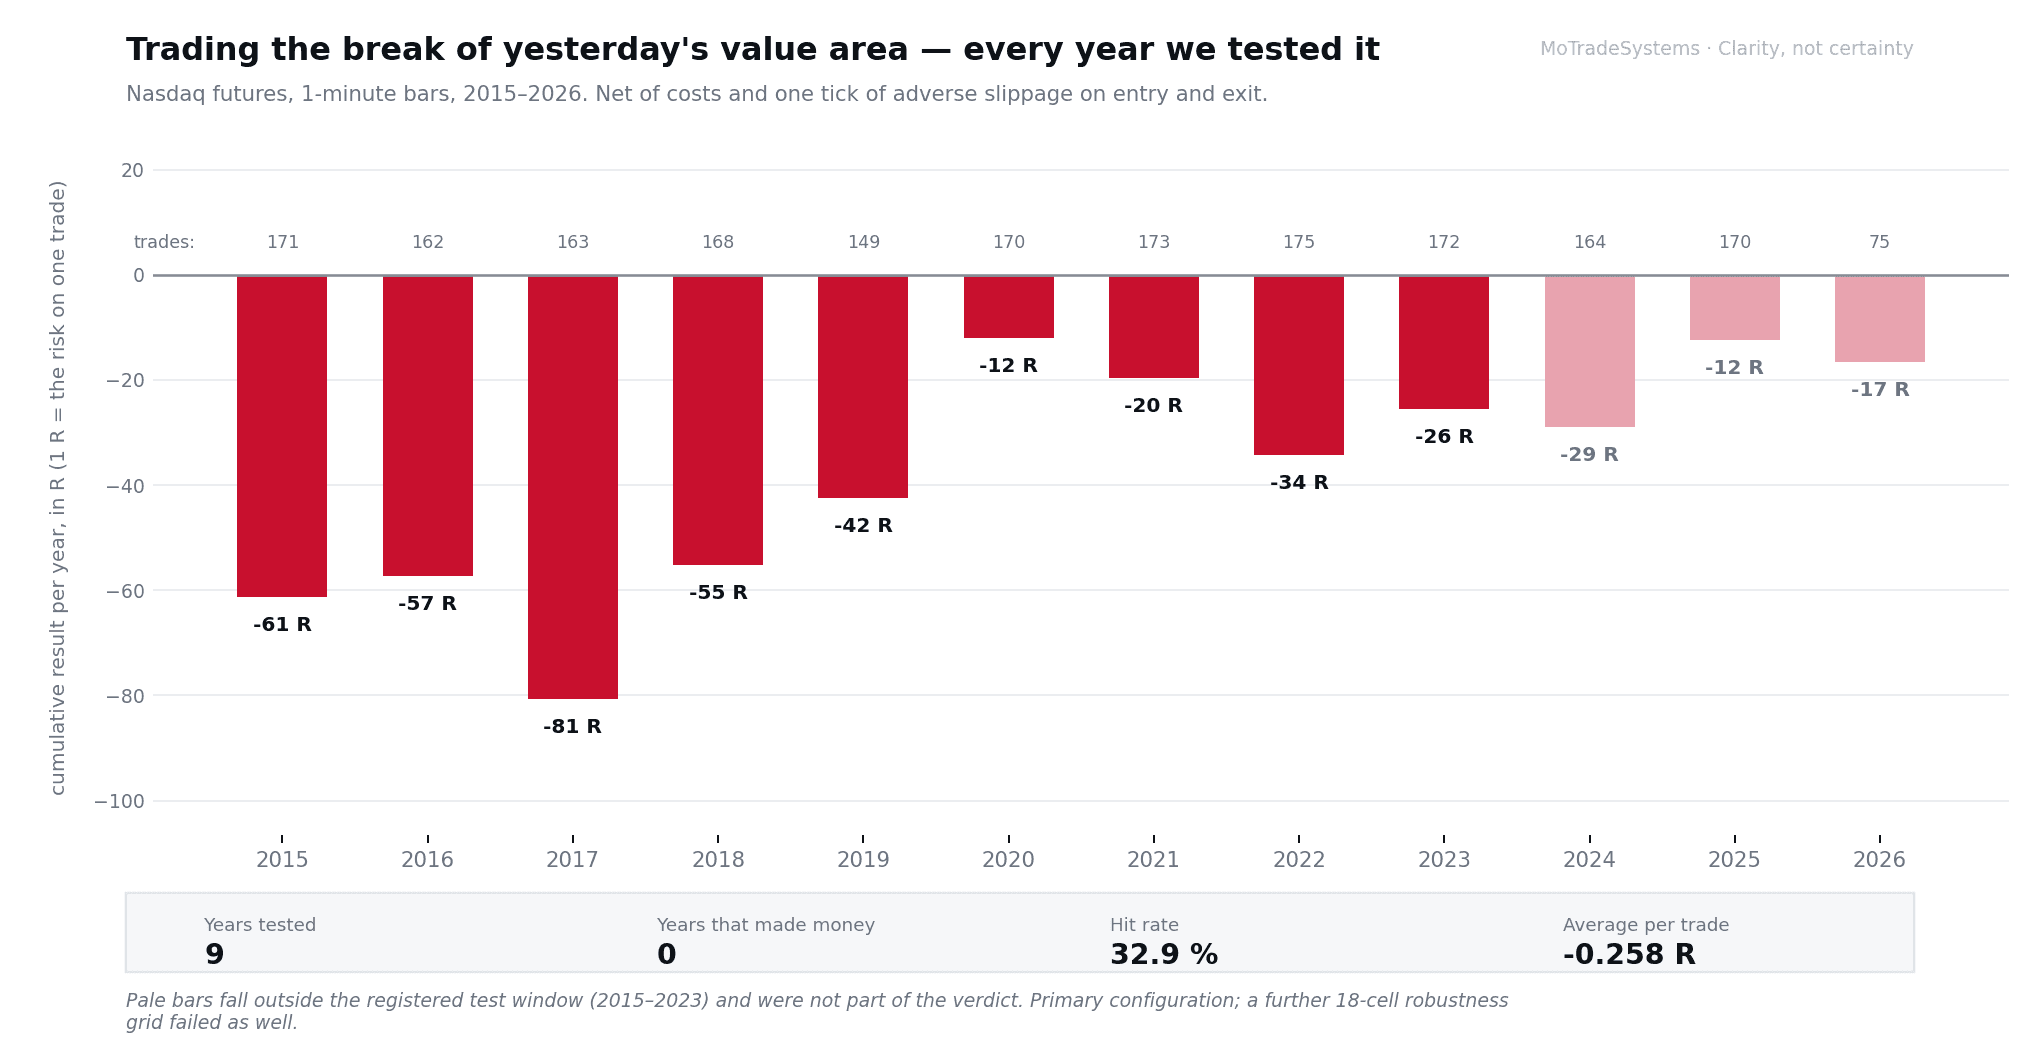
No measurable edge. Nine years of Nasdaq futures, 1,503 trades, one configuration frozen before we looked at the data. Net of costs and one tick of adverse slippage on both entry and exit. Not one profitable year.
Hypothetical backtest results. Read the full disclaimer at the bottom of this page.
What we actually tested
We wrote the configuration down, committed it, and only then ran it. That order matters: if you fix the rules after seeing the results, you are no longer testing an idea, you are describing one.
The configuration: 1-minute Nasdaq futures data, regular trading hours. Yesterday's volume profile fixes the value-area high and low — they do not move during the session. The sequence has three parts, in this order: a full-body candle accepting price beyond the edge (body filter 0.5), a pullback back to that edge, and only then a continuation trigger in the breakout direction. Entry at the next bar's open, one tick worse than that price. The stop is structural — the extreme of the pullback plus or minus a tenth of a 14-period ATR — so risk per trade moves with the market instead of being a fixed number of points. Target 2R. Stop is checked before target on the same bar. Flat at the end of the day.
What about days that gap? Yesterday's value-area edges are fixed before the session starts, so a day that opens beyond them has already done the thing the rule waits for. We did not treat those sessions as a special case and we did not remove them. The sequence still has to complete on its own terms — a full-body acceptance candle, a pullback to the edge, then a continuation trigger — so a gap never creates an entry by itself. What it does is quieter: it starts the sequence further from the level the whole reasoning rests on. It is the first objection anyone who trades this rule will raise, and it deserves an answer before the results, not after them.
Costs: a fixed round-turn cost plus one tick of adverse slippage on entry and on exit, applied to every fill. We also ran it at two and four times that cost level. The direction of the result never changed.
What we did do beyond the primary run: an 18-cell robustness grid — the same idea with different body filters, pullback depths and targets. All 18 were rejected. We say that because it is the opposite of the usual claim: we did not find a version that worked and then publish that one.
The self-check: the instrumented run we exported these numbers from reproduces the original engine trade for trade — 2,940 sessions and 1,912 trades across the full instrumented run, of which the 1,503 inside the registered window are the ones reported here. Maximum deviation zero. The chart below is not a retelling of a result. It is the result.
What the numbers say
Hypothetical backtest results. Read the full disclaimer at the bottom of this page.
Nine years inside the registered test window, 1,503 trades, not one year in the black. The hit rate is 32.9 % and the average trade loses about a quarter of what it risks. The profit factor is 0.68 — for every unit of risk the winners brought in, the losers took about one and a half back out.
The part worth sitting with is the control. We re-ran the same sessions with random entries and the same costs and asked where our rule landed in that distribution. It came out at the 83rd percentile. We require the 95th. So the honest sentence is not "it failed" — it is: it lost less money than most random entries, and that is not the same thing as an edge. A rule that is merely less bad than chance is still a rule you are paying to run.
This is what a single chart can never show you. One session shows the mechanics. Only every session shows the outcome.
What this means for your account
Here is the thing worth taking away: the level was never the problem.
Where most of yesterday's business happened is real information — it is one of the few things on a retail chart that is not a curve fitted to price. What our test says is narrower than "volume profile does not work". It says this: as a trigger, that edge did not pay. As context, it is among the most useful things you can put on a chart — knowing where price stands relative to where trade actually took place, and whether the move you are looking at has participation behind it or is thin.
That is the distinction our Volume Cockpit is built on. It shows you where price sits in the day's traded volume and how much participation is behind the current move. It does not tell you to enter, because our own test is the reason we did not build it that way.
We did not soften the finding in order to sell the tool. We built the tool the way the finding said it should be built.
See what Volume Cockpit shows →These results are based on simulated or hypothetical performance results that have certain inherent limitations. Unlike the results shown in an actual performance record, these results do not represent actual trading. Also, because these trades have not actually been executed, these results may have under- or over-compensated for the impact, if any, of certain market factors, such as lack of liquidity. Simulated or hypothetical trading programs in general are also subject to the fact that they are designed with the benefit of hindsight. No representation is being made that any account will or is likely to achieve profits or losses similar to these being shown.
Trading futures and other leveraged products involves substantial risk of loss and is not suitable for all investors. Past performance is not indicative of future results. This content is for educational purposes only and is not investment advice.