
Illustrative example · Clarity, not certainty.
The "sure thing" that wasn't.
Illustrative example — no performance promise
You've been here. The news all points one way — obviously bearish, obviously the short, a dead-certain trade. So you size up. And the market does the exact opposite: it squeezes, rips your stop out, and the "sure thing" takes a chunk of your account. Here's what the headlines leave out: the loudest story is rarely the whole story. The sober data underneath — rates, liquidity, credit stress, how crowded positioning already is — often says something quieter and very different. Macro Sentiment reads that, not the noise.
The morning read — before you bet the account on "obvious"
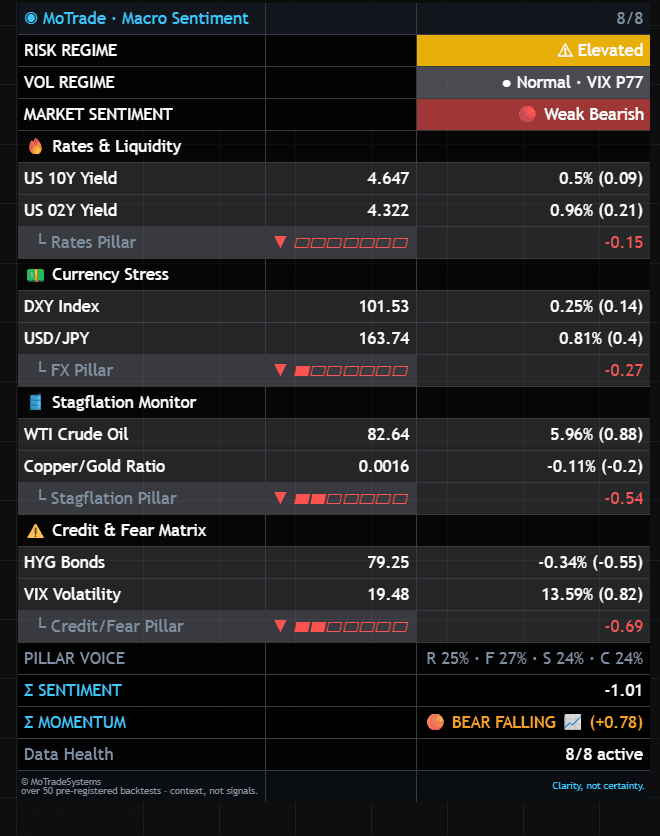
Macro Sentiment reads the room
Risk Regime ⚠ Elevated · Σ Sentiment: not one-sided · Data Health 8/8
- It means:
- It's jumpy — the kind of tape where crowded "sure things" reverse hardest — and the composite isn't nearly as one-sided as the headlines. The data hasn't confirmed the story. All eight feeds live, so this is the numbers, not a hunch.
- You do:
- So you size for being wrong, not for the fantasy that you're right — a scratch if it squeezes, not the account. It never tells you what to buy.
Volume Cockpit checks the move
Vol:Y — move without volume · Effort vs Result: exhaustion
- It means:
- The move everyone's piling into is running on empty — a possible fakeout, not a confirmed break.
- You do:
- So you don't chase it. Unbacked moves are exactly where a squeeze detonates — you wait for volume to agree, or you stand aside. Context, not a signal.
The decision is a risk decision, not a prediction
The panel doesn't tell you to skip the trade. It tells you the data doesn't back the sure thing — your cue to size for being wrong, not for the fantasy that you're right. When the squeeze comes, that smaller size costs you a scratch instead of the account. Here's what that looks like in numbers.
The mechanic, in numbers you can reproduce
Geometric sizing shrinks your position after every loss, so the same cumulative-risk curve climbs more slowly than fixed sizing would — but it still climbs toward a ceiling: the smaller of your effective daily budget and your trailing cushion, $1,200 here. Your hard-stop sits at 80% of that ceiling and stays fixed, and a bad enough streak reaches it well before the curve could ever reach the ceiling itself. None of this predicts a win; it only bounds a loss.
Illustrative inputs: $50,000 account · 3% daily limit · 20% safety buffer · $2,500 trailing cushion · 25% daily / 15% trailing fractions · MNQ, 20-pt stop. Change any of them in the calculator.
| Loss # in a row | Risk budget for this trade | Contracts | Risk budget used so far |
|---|---|---|---|
| 1 | $94 | 2 | $94 |
| 2 | $90 | 2 | $184 |
| 3 | $87 | 1 | $271 |
| 4 | $84 | 1 | $354 |
| 5 | $80 | 1 | $435 |
Three losses in a row use up $271 (28.2%) of your hard-stop — and this same climbing curve reaches it by trade 13 , not because the curve runs dry, but because the rule catches it first.
Illustrative example — no performance promise. Every value on this page is illustrative — chosen to show how the tools and the sizing math work together, not a claim about any real account or outcome. The tools provide context, never buy/sell signals or price targets. Education/analysis — not investment advice. Trading involves substantial risk of loss.
Backtest ≠ Live. Clarity, not certainty.