
Buying the pullback in a trend
The rule
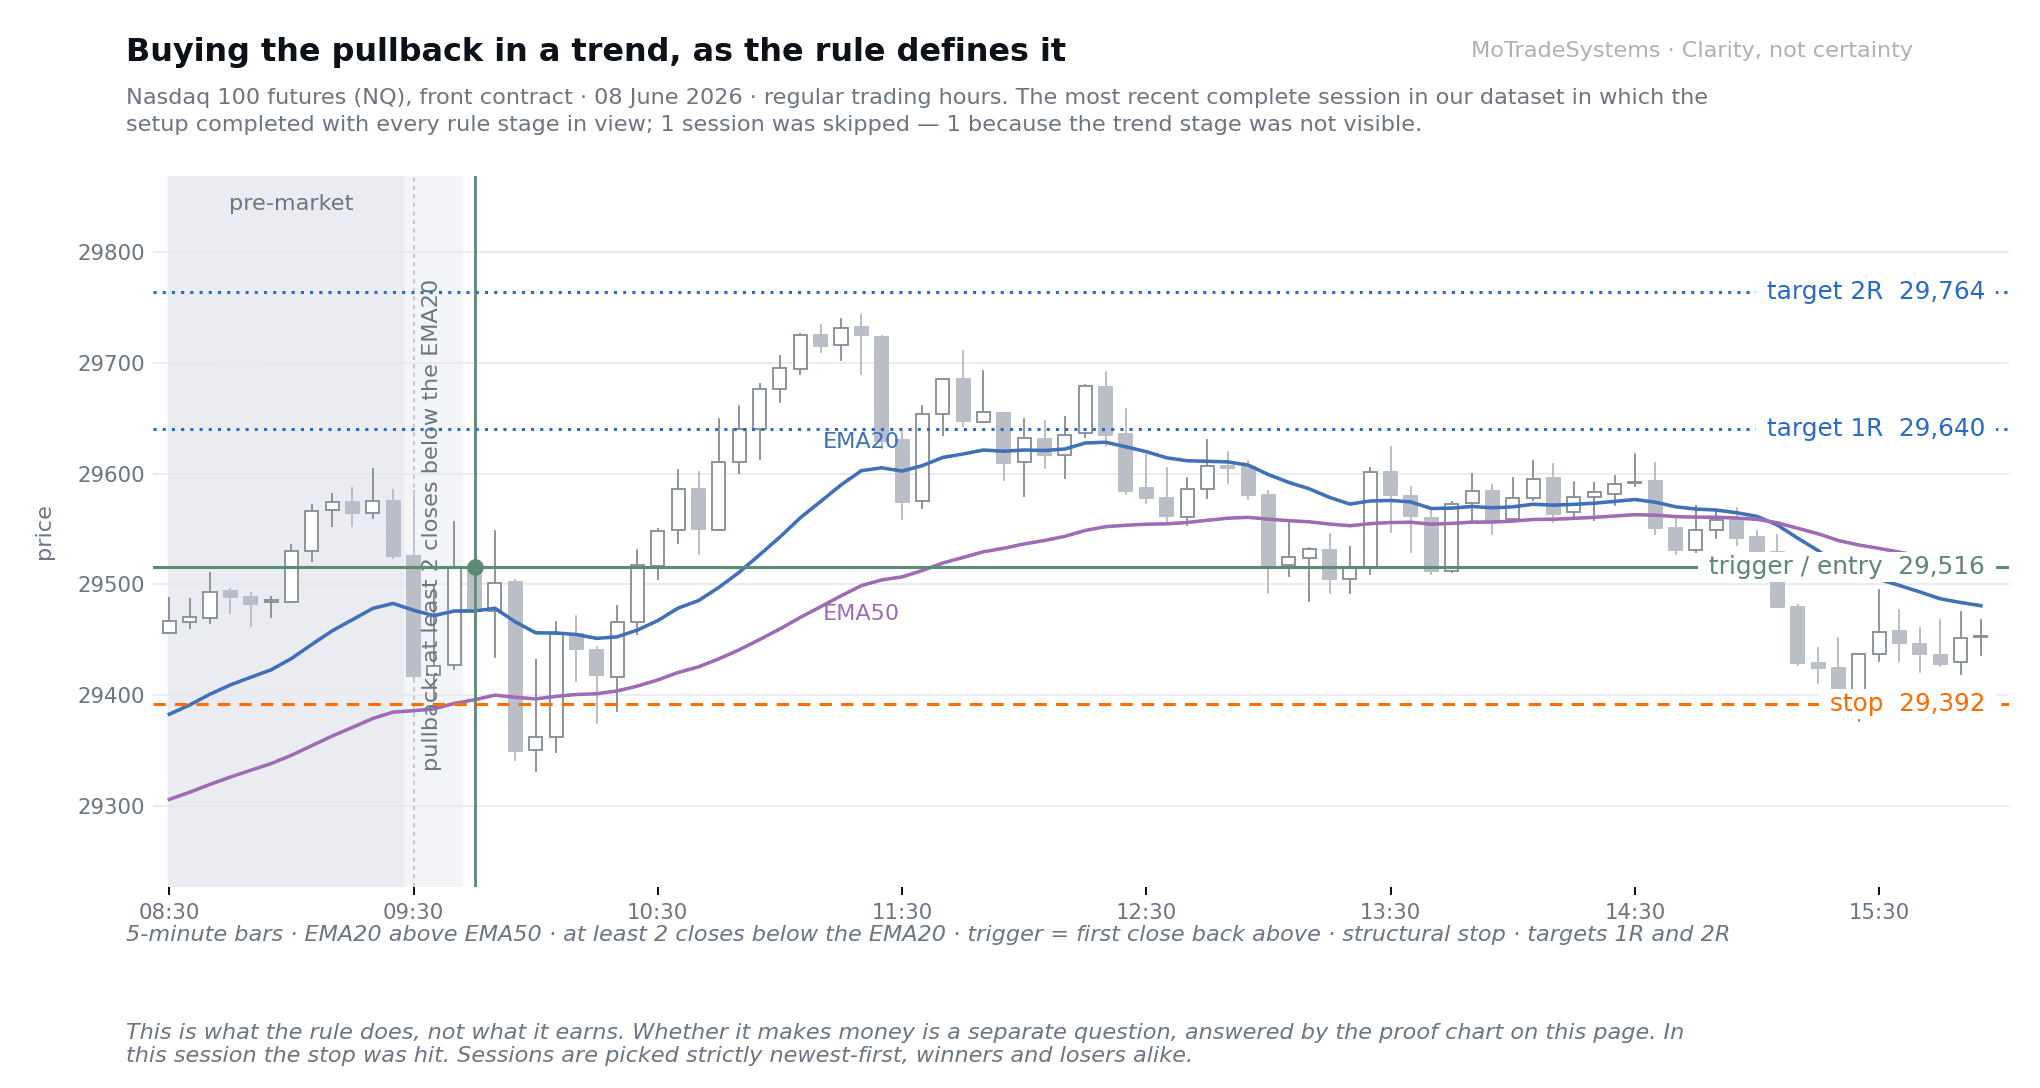
Price is trending up. It dips. You buy the dip, because you are getting the same direction at a better price. It is the most taught rule in technical analysis, and it is the first thing most people try.
The verdict
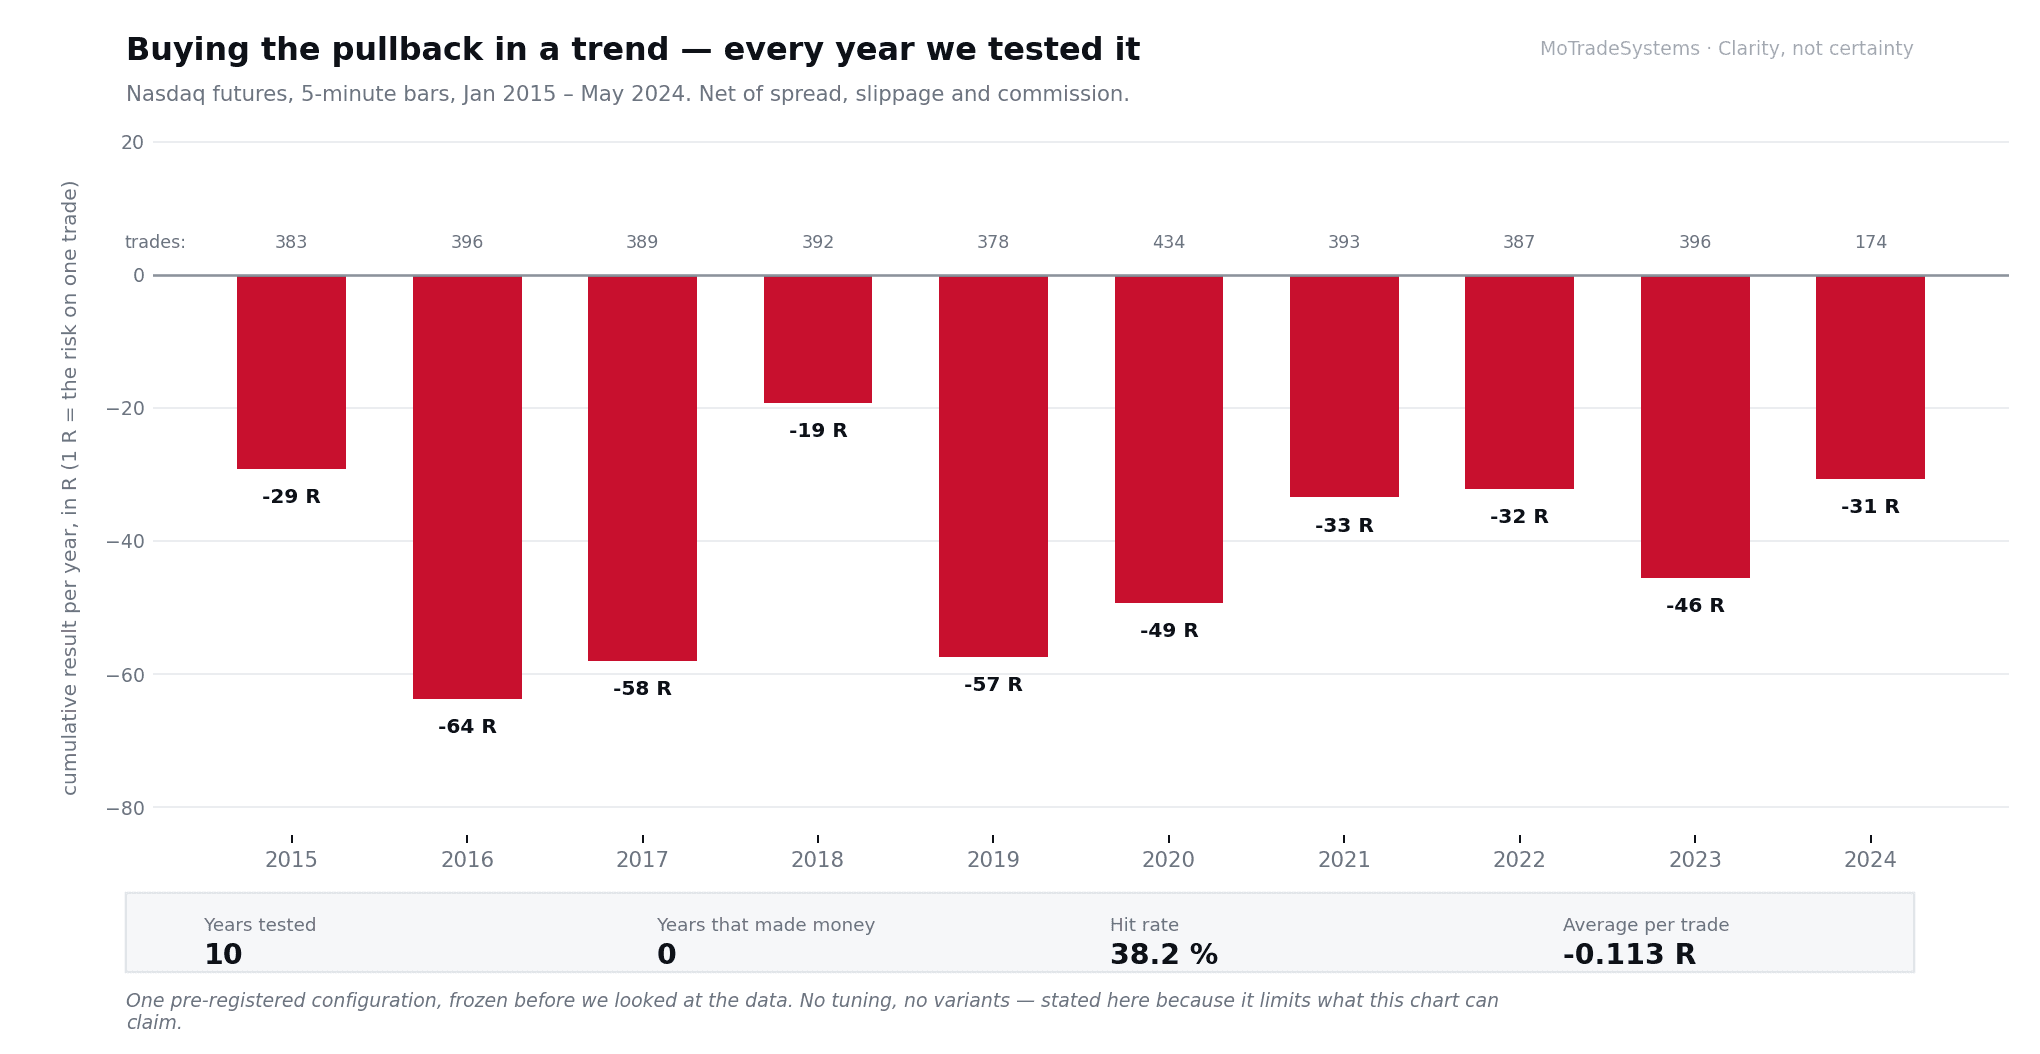
No measurable edge. Ten years of Nasdaq futures — January 2015 to May 2024 — one configuration frozen before we looked at the data. Net of spread, slippage and commission.
Hypothetical backtest results. Read the full disclaimer at the bottom of this page.
What we actually tested
We wrote the configuration down, committed it, and only then ran it. That order matters: if you fix the rules after seeing the results, you are no longer testing an idea, you are describing one.
The configuration: 5-minute bars built from 1-minute data, continuous session. Trend = EMA20 above EMA50 and price above EMA20 at the trigger bar. Pullback = at least two consecutive closes below EMA20. Entry on the first close back above EMA20, filled at the next bar's open, between 09:30 and 15:00 ET. The stop is structural — the extreme of the pullback plus a small ATR buffer — so risk per trade varies with the market instead of being a fixed number of points. Half off at +1R, the rest at +2R, no trailing. Flat by 15:59. One position at a time.
Costs: spread plus slippage plus commission, applied to every fill, scaled to the range of the execution bar. We ran it at three cost levels. It was negative at all of them.
What we did not do: we did not tune it, and we did not test variants. One configuration, one run. We say that because it limits what the result can claim — this is evidence about this rule as written, not about every possible version of it. (The opening-range page is where we did test the variants, five times over.)
What the numbers say
Hypothetical backtest results. Read the full disclaimer at the bottom of this page.
Ten years, 3,722 trades, not one year in the black. The hit rate is 38 % — which sounds survivable until you work out what it means in practice: at 38 %, runs of six, eight, ten losers in a row are not bad luck, they are the arithmetic. The average trade loses about a tenth of what it risks. Small, relentless, and entirely invisible on any single chart.
This is the part a screenshot can never show you. One session shows the mechanics. Only every session shows the outcome.
The obvious objection: “then use a rule that wins more often.” We tested one. Fading an overbought hourly RSI on the same market — the textbook mean-reversion trade — won 51.0 % of its trades: 2,495 trades across its own registered nine-year test window (2015–2023), more winners than losers, and it still lost money. About a tenth of risk per trade, every trade, for nine years. The winners were simply smaller than the losers.
That is why we do not lead with hit rate, and why you should be suspicious of anyone who does. A hit rate tells you how often you were right. It tells you nothing about what being wrong cost you — and that second number is the one that closes accounts.
What this means for your account
Here is the thing worth taking away: the trigger was never the interesting part.
A 38 % hit rate does not fail because the entries are bad. It fails because almost nobody sizes for the losing runs it is certain to produce. That is what ends funded accounts — not a bad entry, but a position size that a normal losing streak was never going to survive.
So before you judge any rule, work out what a normal losing run does to your account. Our drawdown calculator does exactly that, free and without signup: what a given account size and drawdown limit arithmetically allow for, and at which trade in a losing run the room runs out. It computes the numbers you enter — it does not recommend a position size.
Open the free drawdown calculator →These results are based on simulated or hypothetical performance results that have certain inherent limitations. Unlike the results shown in an actual performance record, these results do not represent actual trading. Also, because these trades have not actually been executed, these results may have under- or over-compensated for the impact, if any, of certain market factors, such as lack of liquidity. Simulated or hypothetical trading programs in general are also subject to the fact that they are designed with the benefit of hindsight. No representation is being made that any account will or is likely to achieve profits or losses similar to these being shown.
Trading futures and other leveraged products involves substantial risk of loss and is not suitable for all investors. Past performance is not indicative of future results. This content is for educational purposes only and is not investment advice.